CFM and the “POP” (M⇔Bst) Investment Principle
American Butterfly 3
The Network on a String
Prequel
CFM and the “POP” (M⇔Bst) Investment Principle
By Nick Ray Ball Decemeber 2012
Part 1. CFM – Compatible Finite Mathematics
Part 2. POP – The Pressure of Profit
Part 3. The Baby POP (M⇔Bst) Investment Principle
CFM – Compatible Finite Mathematics
CFM is the mathematics of the network. The principals ingrained in me throughout the 12 years I spent as a Music Programmer before I moved into web development in 1999. For music, the software I used was called Q-Bass. And for 12 years most days I worked with 64 tracks, making sets of 8 bars. Looking at the micro structures within and joining them together to make songs.
The reason the network was built around CFM was probably due to instinct, but definitely the need to accommodate a global knockout league structure. The initial considered “The FIFA Global League,” an idea they coveted, and a company I knew well enough to get an audience with, should I wish. And so it was that the S-World Network and business plan revolved around 16 global consortiums/franchises, which were to be sub divided, and subdivided again in sets of 4, 8, 16 and 32.
Six months later, after an interest in Chaos Theory had seen me attempting to solve the problem of “rounding errors” within the network mathematics I wrote an instinctive equation: E x TOE = MC2 + TOE/∞ -16 = 16 PPG. And which in turn resulted in an exploration of the Mandelbrot Set Fractal, from where the concepts of finite math, doubling numbers, and creating baby networks originated.
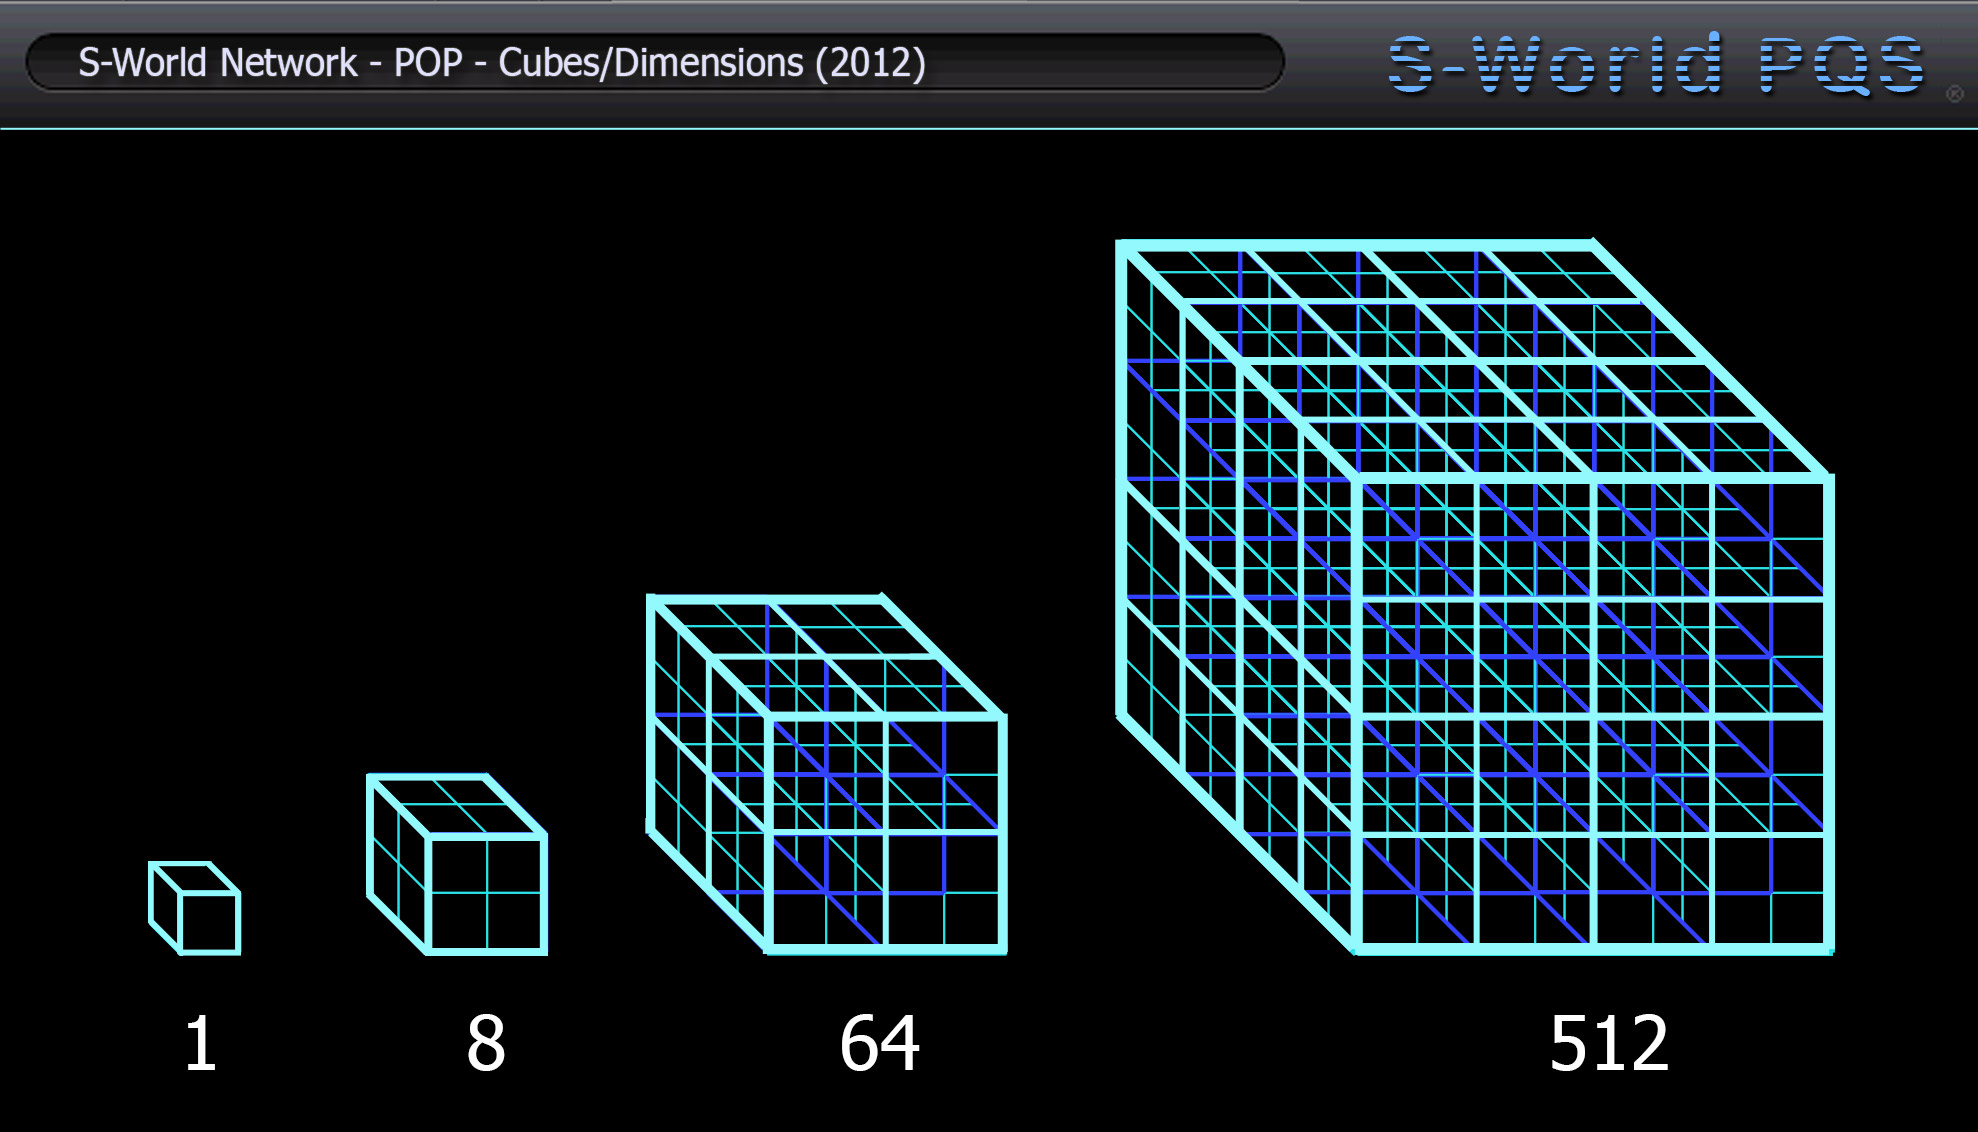
Originally entitled “Chaos Science,” CFM looks to simply box things nicely into cubes. One symmetrical cube fits inside another 8 times, eight fit inside another eight times, so giving 64 and so we count 1 > 8 > 64 > 512 > 4096 > 32768. One represents a single network, whereas 32,768 would be the 2050 Global Network Cube.
The basic principle is to organise accounting within number sets that are manageable, which when multiplied or added cannot lead to periodic numbers. One can seemingly use 2 > 4 > 8 > 16 etc, but this is best used in such a way as to make a block that can neatly fit inside a cube.
CFM: Compatible Finite Math is the art of compartmentalising businesses and networks earnings. So they fit neatly into cubes, hence SUSY, like the link between General Relativity and Quantum Mechanics, where one can’t marry the probability of Quantum Mechanics with the certainty of General Relativity. Equally, within a network one can’t possibly add up all the separate companies’ earnings and hope they will magically tally into an even $2 or $4 billion unit.
Instead, we are looking to smooth the jitters and create a work-around; hence the name “COMPATIBLE Finite Math” not “Finite Math.” One can consider the cube structure as “Finite Math,” the quickest and most symmetrical way to compartmentalise; everything fits inside of everything perfectly, even for a human it makes calculations simple, especially within a 3D simulated hologram, as it should be presented.
As an initial consideration it really is that simple. If in the very distant future all economics were centred on units that were in simple blocks which when added could never create an odd number, it would be pretty hard to run out of processing power when calculating them.
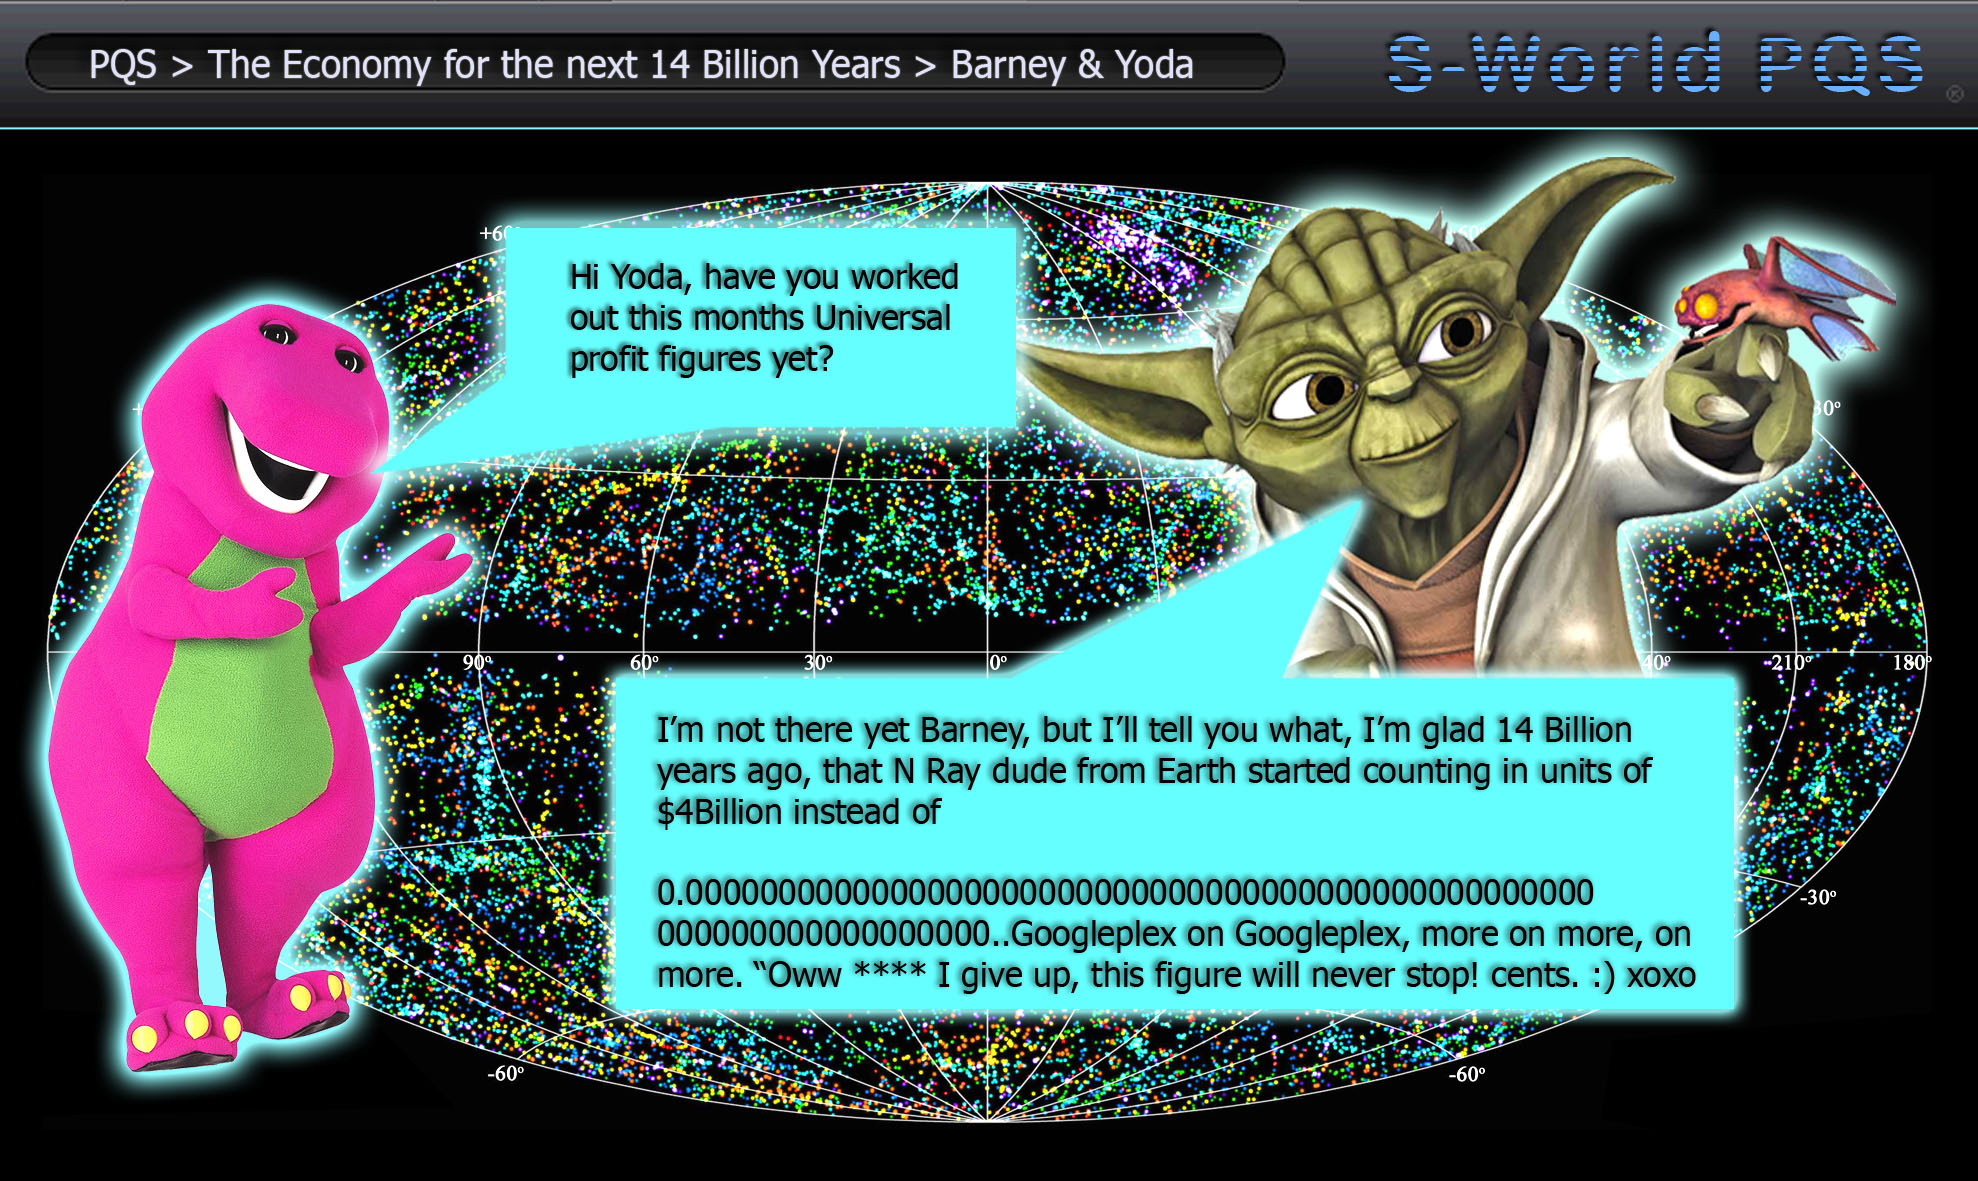
In respect of the mission to make the physics and principles simple, at the time of initial consideration a cartoon was created to illustrate the principle.
POP – The Pressure of Profit
The “POP” principle was created specifically to build the network structure in CFM, where network earnings would fit neatly within the 1 > 2 > 4 > 8 > 16 framework. Albeit it was considered as the number “1” was odd, the sequence needed to start at 2 > 4 > 8 > 16 > 32 > 64 etc.
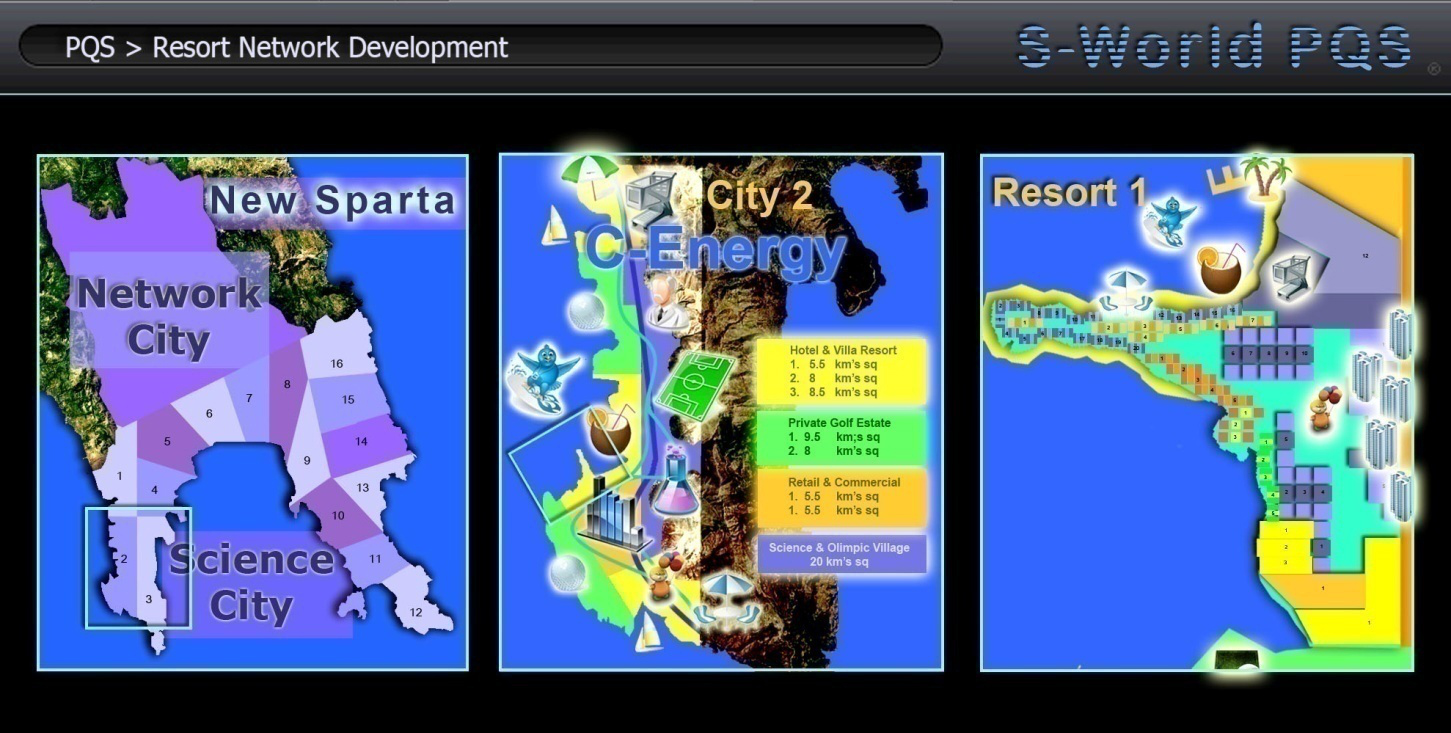
Initially considered and applied to profit forecasts from the August 2011 concept “Facebook Travel,” starting in “New Sparta, City of Science” Greece, and then expanding across the globe. Creating and developing new resort networks and operation centres along its journey.
riginally the “POP” principle started with network sectors generating $4 billion in profit. And considered, if all the profit made over $4 billion was saved, until it could be used to build a new network, and thereafter another and another. The network would build itself in units that all made $4 billion. So long as a network performed, it would always generate $4 billion. Its profit would become predictable and when considered on a gargantuan scale, the figures would stick to the framework of CFM.
There are a couple of points of argument that required solutions. But in the same way that removing humans from financial data-capturing positions would be an improvement in financial efficiency it is not a cure to all financial problems. The “POP” principle was a further improvement. In many ways CFM is about using as many tricks as one can, to guide network profit into creating more and more stable networks/cubes, herding them together within the 1 > 8 > 64 > 512 > 4096 > 32768, pure “Finite Math” cubed hierarchal structure.
At this point, an argument is presented for teaching Photoshop to math and physics majors. As if not for the ability to create graphics, the huge “added advantage” to the “POP” principle may never have been considered, as whist plotting out “POP” global expansion up popped an interesting side effect.
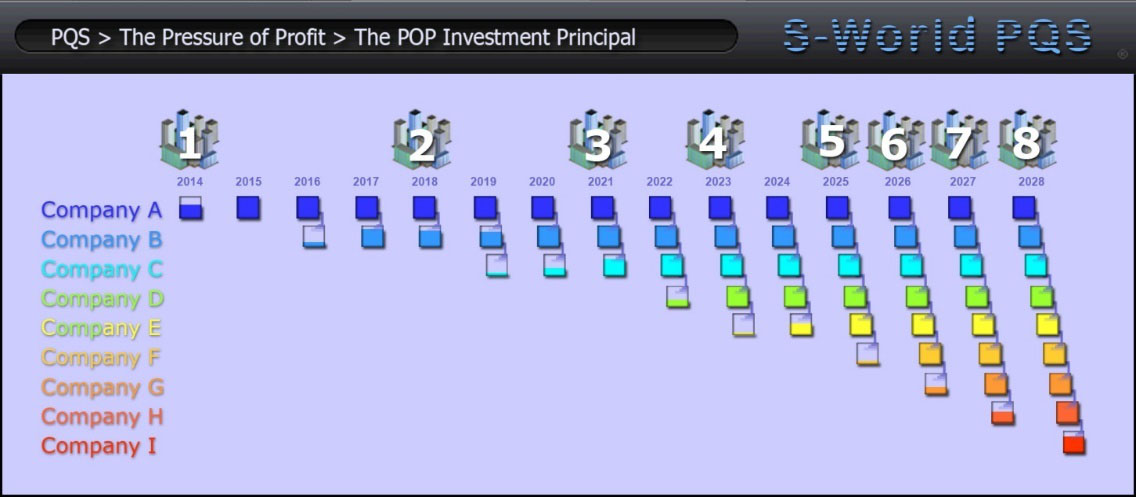
Of course, the more networks contributing to the creation of the next network, the faster new networks would be created, hence the name, the “Pressure of Profit” (POP).
In October 2011, the creation of the “POP” investment principal saw the creation of the first semi competent physics chapter within “The Spartan Theory.” This chapter put the physics centre stage with economics and was named “EEE – The Economy for the next 14 Billion Years.” The EEE stood for “Ecological Experience Economy,” and the reference to 14 Billion years was reflective of the consideration that if at this point we were to start an economic system based around the POP principle. Like the cartoon showed in 14 Billion years time, it would make the universal economy manageable.
“POP” is one way we assist the network to stay within its CFM framework. Not perfectly, but by the time the various other techniques are added, we have a manageable finite economy, with the jitters suitably calmed.
The Baby POP Investment Principle (M⇔Bst)
The precocious “Baby POP”
Eight months after creating “POP,” a refined version lowering its profit cap was created; the precocious “Baby POP” (M⇔Bst) investment principle. “Precocious” because it is not creating nice even boxes, just starting the process. As a standalone piece of mathematics, one would never tell that it is a part of a larger plan to eliminate rounding errors.
Before describing and presenting the “Baby POP” spreadsheet, maybe it’s best to explain why “Baby POP” was necessary in the first place. The original “POP” investment principle was created around the New Sparta property development, a collection of adjoining physical networks in Greece. Due to the various profit centres provided by affiliate and other initiatives, the mathematics were such that it was possible for each individual New Sparta network to generate over the $4 billion profit per annum within three or four years. Increasing upwards thereafter.
The “Give Half Back” principle was applied with 50% being split between dividends and initiatives to support the networks and Greece, generating more than enough money to support extensive research and development whist stabilising the Greek economy. With the other 50% was saved and then used to create new networks in other global locations as per classic “POP” method.
When the starting point was moved from Greece to the USA, as Greece’s budget deficit at the time was $41 billion in comparison to the USA at around $1,500 billion, either a lot more networks were required or networks needed to create more profit. As such, for a starting position in the USA the number of networks was multiplied by 16, so creating an eventual target of 8,192 networks.
Initially the calculations were worked out by looking to create these 8,192 networks in one phase, which was logistically and financially possible but far from ideal. Moreover the trouble was that the revenue and profits calculated from the affiliate systems had to be divided by 16, and as such each individual network was not making anywhere near enough profit.
For a while, an element of doubt cast its shadow over American Butterfly. And considerations of the “POP” principle were cast aside as work commenced into the logistics of retail catchment areas and other revenue streams that could create direct profit for the individual networks. A useful exercise but ultimately the figures were not supportive of a successful venture.
Eventually, considerations returned to the POP principle but looked at a much longer timescale. Starting with fewer networks and working to build towards the eventual critical mass of 8,192 networks. The initial phase of networks halved, halved again, and again. Until eventually a figure of 256 initial networks were generated. Approximately five per US state was decided upon for a first direct investment phase, with the same amount again planned a couple of years later, where after each would over a 22 year period via “POP” method create 15 subsidiary networks.
Logistically this worked, as initially the affiliate revenue streams and profits split between the 512 networks were enough to satisfy the investors, support the operation centres and still save up enough money to invest in their subsidiary networks. As the pace of network creation was far slower, it also allowed time for the networks to generate independent income from their local catchment areas over time.
The pure “POP” concept of initially generating annual profits of $4 billion was adapted to lower figures. For the first phase the figure was lowered to $800 million, where after $700 million for the first subsidiary network. After that is $600 million for the second one then $500 million for the balance of networks.
The graphic below and the following spreadsheet follow the “Baby POP” journey. Creating the critical mass of revenue required to power the USA and absorb the Medicare & Medicaid costs by the mid century.
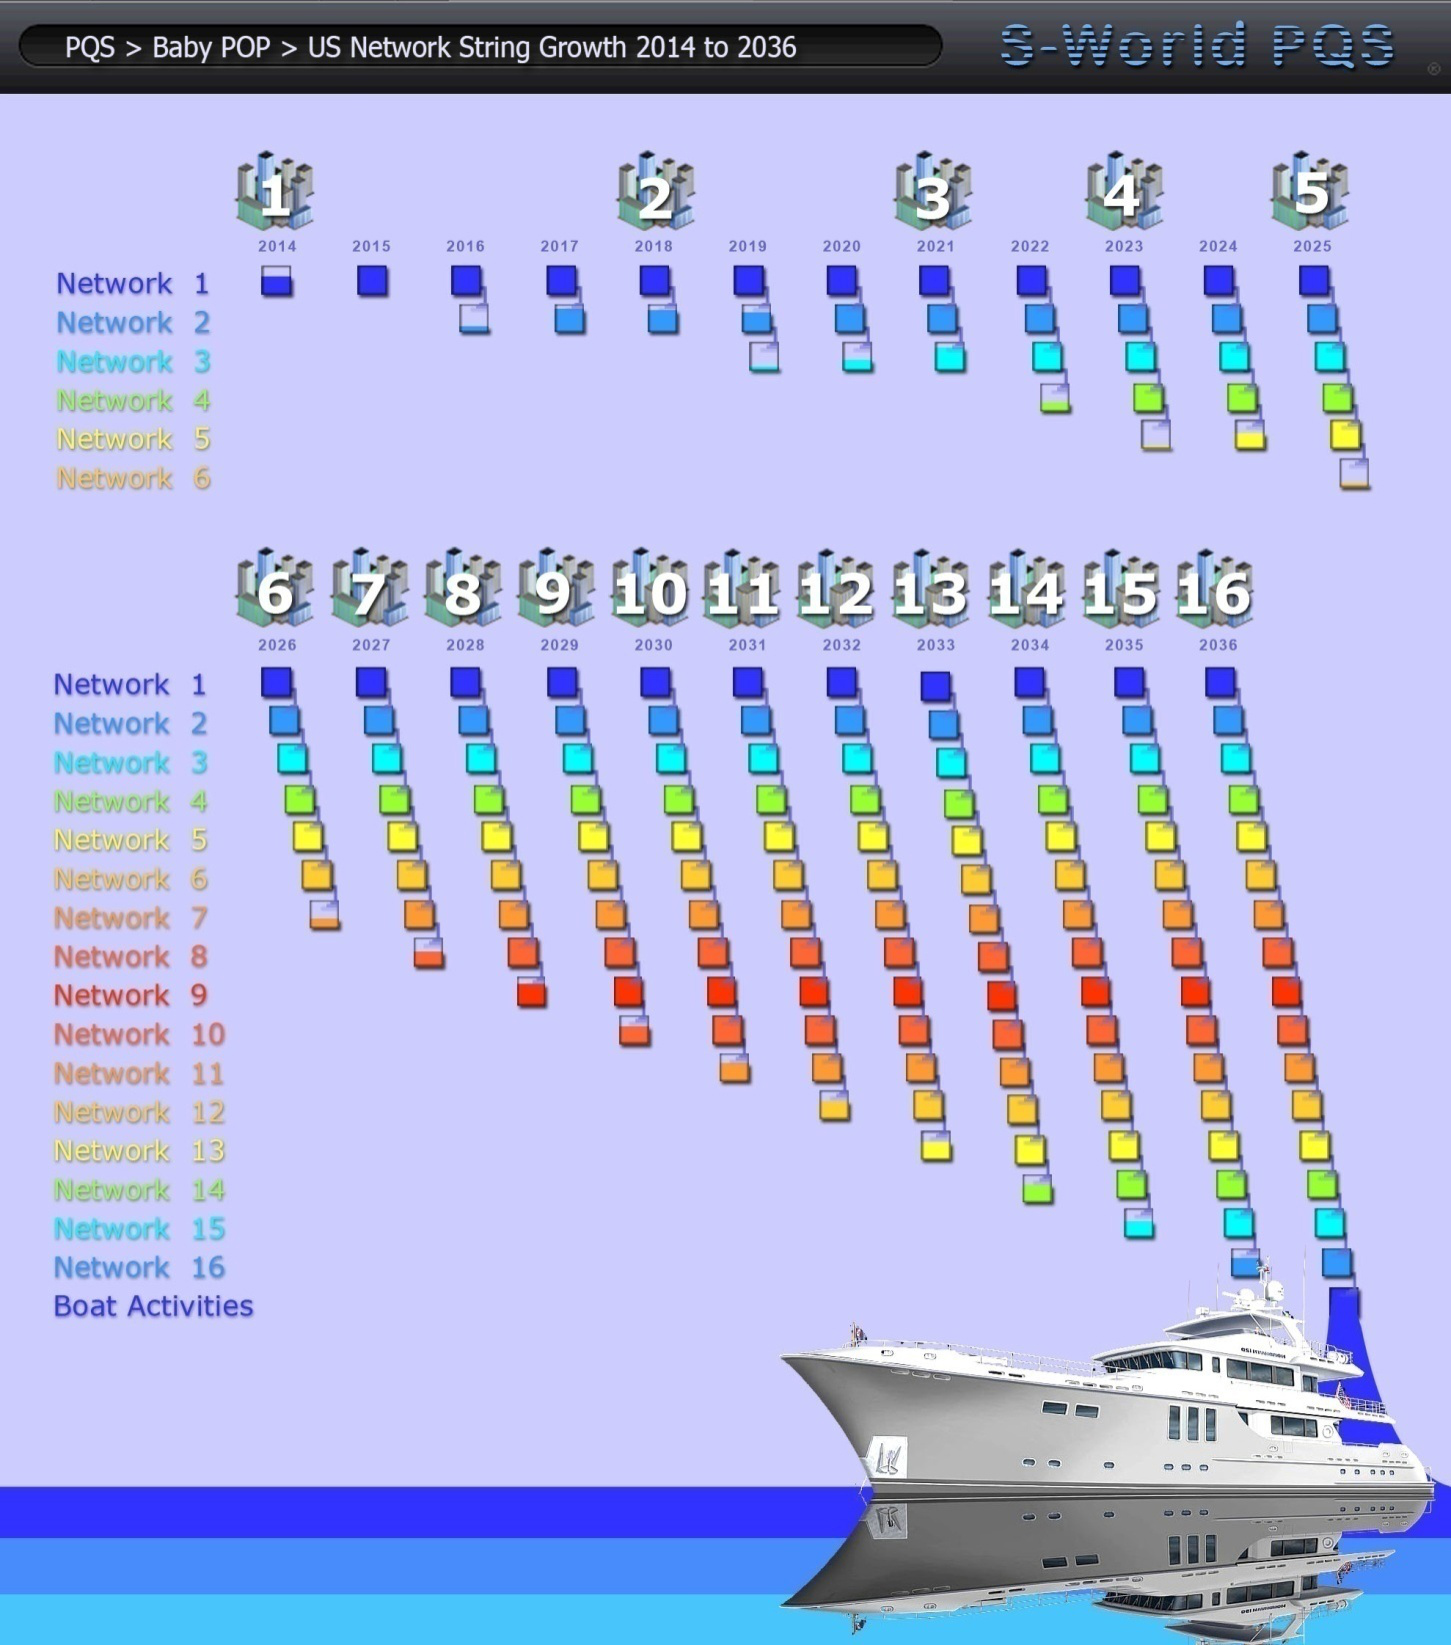
Above we see the first of four double pages illustrating the creation of an M⇔Bst “Baby POP” string.
Starting with the basics, top left RN stands for Resort Network. This is followed by the year.
In the row beneath after 2014 we see an initial investment. Usually this comes in one chunk at the beginning of the process. However for the first network, half ($1 billion) comes in 2014 the balance in 2016 and 2017. This allows plenty of time to choose appropriate local companies as partners.
Next we go to the annual profit; $200 million in 2014 rising to $800 million in 2017. Totalling $2 billion over the first 4 years, most of this profit can be generated by the internal construction process.
Moving over to the right hand side of the spreadsheet in 2014 we see $200 million recorded as cash flow and subsequently banked.
In 2015 the process repeats. This time adding an additional $400 million in profit to the $200 million and placing $600 million in the bank.
In 2016 $600 million is recorded as profit. This added to the $600 million in the bank affords a $1 billion cash injection into the Resort Network construction process (Re-invest column).
2017 is the last year before the Mother Resort Network enters the “Baby POP” process. Until now all operational expenses are covered by the initial investment and no capital has been used for Special Projects.
In 2017 RN1 generates $800 million in profit which when added to the $200 million left in the bank allows a $1 billion investment into the next resort, RN2, the baby of RN1. This $1 billion is matched by new investment and becomes the start up funds for RN2.
Before examining RN2 please look at the bottom (dark purple) line of RN1. To the left $800 million in annual profit is recorded, to the right we see the profit split into 3 divisions, GHB (Give Half Back) is operational expenses, solar and other alternate energy projects & medical initiatives. Then the balance of $500 million is split 75/25 with $375 million becoming the “Baby POP” investment into RN2 and $125 million returned to the company owners and share holders as network credit dividends.
RN2: Starting in 2018 RN2 starts immediately with $2 billion in investment, half from RN1 and half from new sources. Each year a profit of $375 million in “BABY POP” added to their general profit. Investment from RN1 is injected into the resort so allowing the $1 billion internal re-investment in two years not three and the $1 billion investment to create RN3 in three years not four.
RN3: 2021 please note “POP A” investment from RN1 now by-passes RN2 and goes straight into RN3. Please also note prior to this in the column “POP Over” $525 million has been recorded from the “POP 75%” column of RN2 in 2021. This “POP Over” system happens in all RN’s until their fifth year when the “BABY POP” process starts outright. At which point in 2022 we see RN3 fuelled by “POP A” and “POP B.”
Taking an overview, above we can now clearly see the “Baby POP” process at work. Please note the cost of “Baby POP” decreased over the first four years (in RN1 $375 million, in RN2 $300 million, in RN3 $225 million, and from RN4 onwards $150 million). Please also note profit input has been lowered from $800 million to $500 million. This is partly in consideration of lucrative tenders being snapped up by the first four networks, and partly to allow for the WOW factor diminishing over time, lessening the PR benefits.
However this lowering of expectations is not simply a precautionary measure. As important is the principle that from the fourth Resort Network onwards $150 million is all the capital that is needed to complete the league of 16 resorts in a timely fashion. And so leaving additional earnings for “Angel POP,” Satellite and Super String Networks.
In 2023, by the time of the launch of RN4, it is receiving over $1 Billion a year in “Baby POP” funds from RN’s 1, 2 & 3. By 2025 “Baby POP” funds from RN’s 1, 2, 3 & 4 are enough to create a new Baby Network every year.
Note: As the “Baby POP” process diverts from Baby to Baby, the Mother (Anchor), first and second Babies develop strong footholds in every network within the string, in many cases opening new stores or business interests throughout.
Note: Profits from the Operation Centre including: Sale of energy, private clients at hospitals, advertising revenue, network charges and all building profits (not suppliers) are distributed to the businesses within the network increasing earnings by +/- $150 million.
Moving into the second half of the creation of an M⇔Bst “Baby POP” Network String, come 2029 the network is flying. Recording just under $2 billion a year from “POP Over” and “POP A to E,” by this point the “Baby POP” process has for all intents and purposes created a mini tidal wave of profit which is all but unstoppable. Should any network have a hiccup, it will make little difference.
Come 2034 and the launch of Resort Network 14, the tidal wave of “Baby POP” capital injections have collectively reached over $2.7 billion a year, from 11 different sources.
In 2036 the 16th & final Resort Network is launched receiving over $3 billion in its first year. However as RN16 has no baby and instead of investing in a new Baby Network it strengthens by investing in itself, procuring raw materials, minerals, metals and other tangible assets alongside building industry and energy resources.
By its fifth year, the year it starts contributing to operations and projects, before making a cent in profit Resort Networks 16 will have internally invested over $11 billion dollars. This investment will undoubtedly result in the final Baby Network internally generating over $1 billion a year, and so it becomes stable. Indeed a stable network that still receives $2.7 billion a year from the “Baby POP” process.
And so with the initial network RNI receiving the most e-commerce profits and RC16 receiving “Baby POP” funds on top of its general profits the first and last networks in the league have significant strength and make considerable profit. As such RN1 adopts the name “The Anchor” and RN16 “The Boat” as it is ready to sail on to new ventures.


